Monitor anything with Telegraf, InfluxDB, Grafana and Python
At Bixoto we use the TIG stack to monitor our systems. “TIG” stands for “Telegraf, InfluxDB, Grafana”. Telegraf is an agent that collects metrics on your servers and sends it to InfluxDB, a database oriented for real-time data. Then, Grafana reads these data points and renders them with nice graphs and provides some alerting. Of course, this is not the only monitoring stack; you can use Telegraf without InfluxDB or Grafana, and Grafana without Telegraf or InfluxDB. There are already good tutorials on how to install and configure these three components so we won’t cover that here.
In this post we’ll focus on how to monitor anything with TIG and Python. We use Python here as an example, but what we’ll cover works with any programming language.
Let’s say we want to monitor how many orders we made in the past hour, both to see how it evolves over time and to send us an alert if it’s abnormally low. We’ll use PyMagento to query Magento orders and write the result in a format that Telegraf can read. Telegraf supports many inputs; here we’ll use a JSON object so we can add other metrics in the future.
Here is the code:
# monitor_magento_orders.py
import json
import sys
from collections import Counter
from datetime import datetime, timedelta

from magento import Magento, make_field_value_query, format_datetime


def main():
    # Create the Magento client
    client = Magento(token="...", base_url="https://bixoto.com")

    # Get the datetime of one hour ago
    utc_max_created_at = datetime.utcnow() - timedelta(hours=1)
    # Make the query to get orders created after this date
    query = make_field_value_query("created_at", format_datetime(utc_max_created_at), "gteq")

    # Initiate our counters
    counters = Counter()

    # Count orders
    for order in client.get_orders(query=query):
        counters["total_1h"] += 1

    # Write the counters as JSON on stdout with a key "metric": "magento_orders"
    json.dump({
        "metric": "magento_orders",
        **counters,
    }, sys.stdout)


if __name__ == '__main__':
    main()
If we run this code with python monitor_magento_orders.py, we get an output similar to this:
{"metric": "magento_orders", "total_1h": 43}
Good. Now let’s add the relevant configuration in Telegraf. Create a file /etc/telegraf/telegraf.d/magento_orders.conf with the following content:
[[inputs.exec]]
  interval = "10m"
  # Adjust with your own path
  commands = ["/usr/bin/python3 /home/myuser/monitor_magento_orders.py"]
  data_format = "json"
  json_name_key = "metric"
This adds a new Telegraf input that executes our Python code every 10 minutes and parses its result as JSON, assuming the key "metric" contains the name of the metric. Depending on what you’re monitoring, you may want to adjust this interval.
Reload Telegraf with sudo service telegraf reload, and wait a bit for the data to come.
Then open Grafana and create a new visualization using our metric magento_order with the field total_1h:
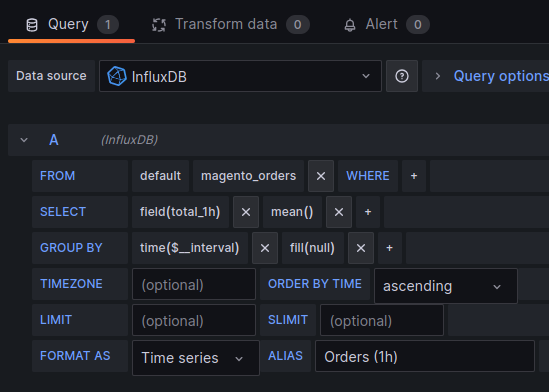
You can tweak the parameters, and the result should look like this:
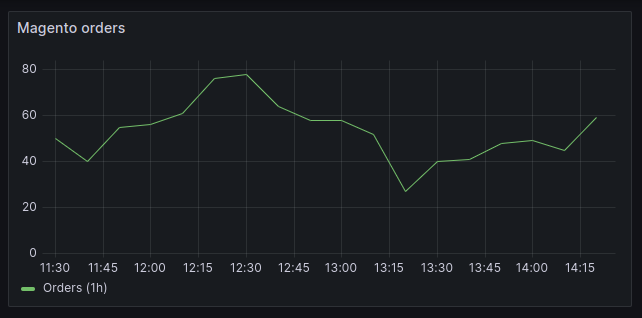
That’s all. This is a simple visualization, but it can be extended with other measurements, for example orders with some specific attribute or status. Once you know how to make queries for visualizations, you can reuse them for alerts. There are already good resources on how to manage alert rules, so we won’t cover this here.
This short post showed how simple it is to monitor anything using TIG and Python: anything that can be measured by a Python program can be monitored. This is not even limited to Python; you can execute any program and Telegraf has a lot of built-in inputs.